

![]()
![]()

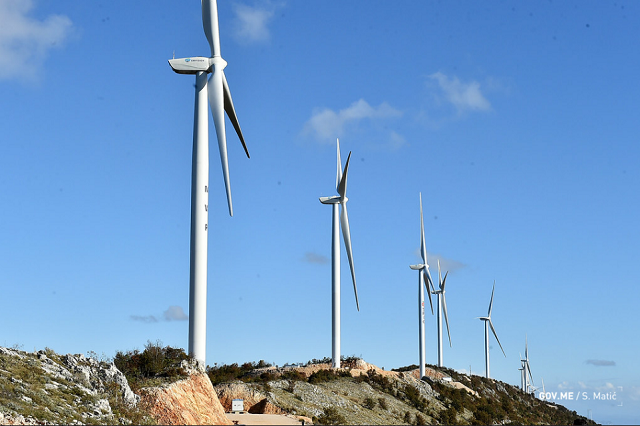
The sourcing and distribution of energy is one of the most pressing issues of our time. Just under one billion people still lack basic access to electricity, and many more connect to the grid through improvised wiring or live through frequent blackouts. On the flip side of the socioeconomic spectrum, a growing chorus of voices is pressuring governments and corporations to power the global economy in a more sustainable way.
The Energy Trilemma Index
The World Energy Council’s Energy Trilemma Index tool, produced in partnership with Oliver Wyman, ranks countries on their ability to provide sustainable energy through 3 dimensions: Energy security, Energy equity (accessibility and affordability), and Environmental sustainability. The ranking measures overall performance in achieving a sustainable mix of policies and the balance grade highlights how well a country manages the trade-offs of the Trilemma with “A” being the best. Use this interactive Index to assess the sustainability of national energy policies.
According to WEC, there are three primary policy areas that form the “trilemma”:
-
Energy Security
A nation’s capacity to meet current and future energy demand reliably, and bounce back swiftly from system shocks with minimal disruption to supply. This dimension covers the effectiveness of management of domestic and external energy sources, as well as the reliability and resilience of energy infrastructure.
-
2. Energy Equity
A country’s ability to provide universal access to reliable, affordable, and abundant energy for domestic and commercial use. This dimension captures basic access to electricity and clean cooking fuels and technologies, access to prosperity-enabling levels of energy consumption, and affordability of electricity, gas, and fuel.
-
3. Environmental Sustainability
The transition of a country’s energy system towards mitigating and avoiding environmental harm and climate change impacts. This dimension focuses on productivity and efficiency of generation, transmission and distribution, decarbonization, and air quality. Using the dimensions above, a score out of 100 is generated. This is the complete list of countries by rankings and individual score in aforementioned fields:
List of countries by sustainable energy policies
| Index rank |
Country name |
Balance grade |
Trilemma score |
Energy
security rank |
Energy
equity rank |
Environmental
sustainability rank |
|---|---|---|---|---|---|---|
| 1 | Switzerland | AAA | 85.8 | 11 | 11 | 1 |
| 2 | Sweden | AAA | 85.2 | 1 | 40 | 3 |
| 3 | Denmark | AAA | 84.7 | 2 | 28 | 2 |
| 4 | United Kingdom | AAA | 81.5 | 28 | 19 | 6 |
| 5 | Finland | AAA | 81.1 | 3 | 33 | 28 |
| 6 | France | AAA | 80.8 | 27 | 29 | 4 |
| 7 | Austria | AAA | 80.7 | 18 | 22 | 16 |
| 8 | Luxembourg | BAA | 80.4 | 56 | 1 | 8 |
| 9 | Germany | AAA | 79.4 | 16 | 30 | 23 |
| 10 | New Zealand | AAA | 79.4 | 20 | 26 | 29 |
| 11 | Norway | CAA | 79.3 | 73 | 20 | 5 |
| 12 | Slovenia | AAA | 79.2 | 9 | 39 | 17 |
| 13 | Canada | AAC | 78.0 | 5 | 21 | 67 |
| 14 | Netherlands | BAB | 77.8 | 39 | 8 | 43 |
| 15 | United States | AAB | 77.5 | 17 | 14 | 54 |
| 16 | Czechia | AAB | 77.4 | 10 | 36 | 40 |
| 17 | Uruguay | ABA | 77.2 | 15 | 46 | 11 |
| 18 | Spain | BAA | 77.0 | 36 | 37 | 18 |
| 19 | Hungary | AAB | 76.8 | 12 | 35 | 33 |
| 20 | Italy | BAA | 76.8 | 37 | 23 | 20 |
| 21 | Iceland | BAB | 76.2 | 38 | 9 | 47 |
| 22 | Latvia | ABA | 76.1 | 4 | 60 | 25 |
| 23 | Slovakia | ABA | 75.6 | 26 | 56 | 10 |
| 24 | Belgium | BAA | 75.2 | 68 | 31 | 27 |
| 25 | Ireland | CAA | 75.2 | 96 | 12 | 24 |
| 26 | Romania | ABA | 75.1 | 8 | 64 | 12 |
| 27 | Croatia | ABA | 74.9 | 24 | 43 | 26 |
| 28 | Australia | BAB | 74.7 | 43 | 24 | 57 |
| 29 | Portugal | BBB | 74.0 | 54 | 42 | 34 |
| 30 | Estonia | BAB | 73.8 | 31 | 38 | 63 |
| 31 | Japan | CAB | 73.8 | 82 | 32 | 39 |
| 32 | Israel | CAB | 73.3 | 78 | 13 | 52 |
| 33 | Malta | DAA | 72.9 | 119 | 27 | 15 |
| 34 | Hong Kong SAR | DAB | 72.5 | 117 | 15 | 36 |
| 35 | Argentina | BAB | 72.4 | 40 | 17 | 53 |
| 36 | Lithuania | CBA | 72.4 | 74 | 51 | 21 |
| 37 | South Korea | BAC | 71.7 | 69 | 16 | 80 |
| 38 | Costa Rica | CBA | 71.6 | 86 | 59 | 7 |
| 39 | Brazil | ABA | 71.6 | 19 | 78 | 19 |
| 40 | Mexico | ABB | 71.3 | 23 | 57 | 50 |
| 41 | Bulgaria | BBB | 71.3 | 33 | 50 | 49 |
| 42 | Russia | AAC | 71.2 | 25 | 18 | 96 |
| 43 | Singapore | DAB | 71.2 | 123 | 10 | 37 |
| 44 | Venezuela | ABB | 70.3 | 14 | 54 | 41 |
| 45 | Ecuador | ABB | 69.6 | 29 | 61 | 42 |
| 46 | Panama | CBA | 69.5 | 91 | 69 | 14 |
| 47 | Greece | CBA | 69.5 | 99 | 45 | 30 |
| 48 | Chile | BBB | 69.4 | 55 | 67 | 48 |
| 49 | Colombia | BCA | 69.3 | 32 | 86 | 22 |
| 50 | Mauritius | CBB | 69.0 | 81 | 66 | 38 |
| 51 | Malaysia | BBC | 68.5 | 41 | 52 | 87 |
| 52 | United Arab Emirates | BAD | 68.3 | 51 | 5 | 114 |
| 53 | Poland | BBB | 68.3 | 70 | 55 | 58 |
| 54 | Cyprus | DBB | 67.9 | 122 | 41 | 45 |
| 55 | Qatar | AAD | 67.9 | 13 | 3 | 125 |
| 56 | Brunei | CBC | 67.7 | 92 | 44 | 66 |
| 57 | Azerbaijan | BBB | 67.7 | 44 | 58 | 59 |
| 58 | Peru | ACB | 66.8 | 22 | 90 | 46 |
| 59 | Kazakhstan | BBC | 66.6 | 60 | 48 | 93 |
| 60 | Armenia | CBB | 66.3 | 75 | 82 | 35 |
| 61 | Ukraine | ACC | 66.0 | 7 | 85 | 65 |
| 62 | El Salvador | BCA | 66.0 | 64 | 87 | 31 |
| 63 | Oman | BAD | 65.5 | 57 | 6 | 123 |
| 64 | Montenegro | CBB | 65.4 | 79 | 74 | 56 |
| 65 | Kuwait | CAD | 65.2 | 72 | 4 | 119 |
| 66 | Turkey | CBC | 64.9 | 89 | 53 | 70 |
| 67 | Paraguay | DBA | 64.7 | 104 | 77 | 32 |
| 68 | Thailand | CBC | 64.6 | 76 | 71 | 79 |
| 69 | Indonesia | BCC | 64.1 | 34 | 88 | 85 |
| 70 | Serbia | BBC | 63.8 | 61 | 79 | 90 |
| 71 | North Macedonia | CBC | 63.7 | 87 | 72 | 74 |
| 72 | China | BBD | 63.7 | 35 | 70 | 108 |
| 73 | Albania | DBA | 63.7 | 125 | 68 | 13 |
| 74 | Iran | ABD | 63.6 | 30 | 47 | 113 |
| 75 | Tunisia | BBC | 63.6 | 59 | 65 | 97 |
| 76 | Trinidad and Tobago | CAD | 63.3 | 85 | 25 | 118 |
| 77 | Georgia | CBC | 63.1 | 95 | 81 | 71 |
| 78 | Saudi Arabia | CAD | 62.8 | 84 | 7 | 124 |
| 79 | Bosnia and Herzegovina | BBC | 62.1 | 65 | 83 | 88 |
| 80 | Bahrain | BAD | 62.1 | 58 | 2 | 128 |
| 81 | Lebanon | DAC | 61.6 | 124 | 34 | 89 |
| 82 | Algeria | CBD | 61.3 | 90 | 49 | 107 |
| 83 | Morocco | CCC | 61.1 | 83 | 89 | 73 |
| 84 | Bolivia | BCC | 60.4 | 46 | 92 | 75 |
| 85 | Sri Lanka | BCB | 60.1 | 63 | 101 | 44 |
| 86 | Angola | ADB | 60.0 | 6 | 103 | 55 |
| 87 | Egypt | BBD | 59.9 | 45 | 62 | 117 |
| 88 | Guatemala | BCC | 59.7 | 53 | 96 | 72 |
| 89 | Gabon | CBD | 59.5 | 88 | 73 | 105 |
| 90 | Namibia | CDA | 59.1 | 98 | 106 | 9 |
| 91 | Vietnam | ACD | 58.9 | 21 | 97 | 110 |
| 92 | South Africa | DBD | 58.9 | 107 | 80 | 103 |
| 93 | Iraq | BBD | 58.9 | 49 | 63 | 116 |
| 94 | Philippines | BCC | 58.6 | 48 | 102 | 68 |
| 95 | Jordan | DBC | 58.5 | 108 | 84 | 98 |
| 96 | Botswana | DCC | 57.7 | 118 | 91 | 76 |
| 97 | Dominican Republic | DBB | 57.6 | 128 | 76 | 51 |
| 98 | Jamaica | DBC | 56.9 | 127 | 75 | 81 |
| 99 | Tajikistan | DCC | 55.7 | 115 | 93 | 69 |
| 100 | Honduras | DCC | 55.3 | 105 | 99 | 84 |
| 101 | Eswatini (Swaziland) | DCC | 55.1 | 109 | 94 | 86 |
| 102 | Nicaragua | DCC | 54.5 | 102 | 100 | 82 |
| 103 | Ghana | CDC | 52.9 | 94 | 105 | 78 |
| 104 | Myanmar | BDB | 51.9 | 42 | 111 | 62 |
| 105 | Cambodia | CDC | 51.6 | 77 | 110 | 92 |
| 106 | Kenya | BDB | 51.3 | 52 | 116 | 61 |
| 107 | Moldova | DCD | 51.2 | 120 | 98 | 106 |
| 108 | Mongolia | DCD | 51.1 | 100 | 95 | 122 |
| 109 | India | BDD | 50.3 | 67 | 104 | 115 |
| 110 | Pakistan | CDD | 49.6 | 71 | 109 | 109 |
| 111 | Ivory Coast (Côte d’Ivoire) | BDC | 49.3 | 50 | 115 | 94 |
| 112 | Zambia | CDB | 47.8 | 97 | 118 | 64 |
| 113 | Cameroon | BDD | 47.4 | 66 | 113 | 104 |
| 114 | Bangladesh | DDC | 47.1 | 114 | 108 | 102 |
| 115 | Zimbabwe | CDC | 46.0 | 93 | 114 | 99 |
| 116 | Mauritania | BDD | 45.6 | 47 | 117 | 112 |
| 117 | Nepal | DDC | 44.3 | 126 | 107 | 101 |
| 118 | Senegal | DDD | 43.4 | 110 | 112 | 111 |
| 119 | Tanzania | DDC | 42.5 | 101 | 121 | 95 |
| 120 | Ethiopia | DDC | 42.3 | 116 | 120 | 91 |
| 121 | Madagascar | CDC | 42.2 | 80 | 125 | 77 |
| 122 | Mozambique | DDC | 41.4 | 103 | 123 | 83 |
| 123 | Nigeria | BDD | 40.7 | 62 | 119 | 126 |
| 124 | Malawi | DDB | 39.1 | 112 | 128 | 60 |
| 125 | Benin | DDD | 36.3 | 111 | 122 | 121 |
| 126 | Chad | DDD | 33.8 | 113 | 124 | 120 |
| 127 | Congo (Democratic Republic) | DDC | 33.8 | 121 | 126 | 100 |
| 128 | Niger | DDD | 30.0 | 106 | 127 | 127 |
The visualization – using data from the World Energy Council (WEC) – ranks countries based on their mix of policies for tackling issues like energy security and environmental sustainability.


![]()
![]()